
Evaluating Sequence Data
General data quality should first be determined by viewing the chromatogram (trace) file. Specific programs are required to view these files. Freeware programs are available and can be downloaded from the web. A current list of software can be found on the Sanger sequencing web page under the resources section.
Sequence samples in the DNA Core facility are analyzed on an ABI 3730 DNA Analyzer. Good sequence reactions can be expected to yield read lengths of at least 1000 bases. Peaks should be evenly spaced with minimal background noise. A chromatogram displaying good quality sequence is illustrated in Figure 1. Full trace results for a pGEM control can be viewed with the following link: pGEM Control Sequence
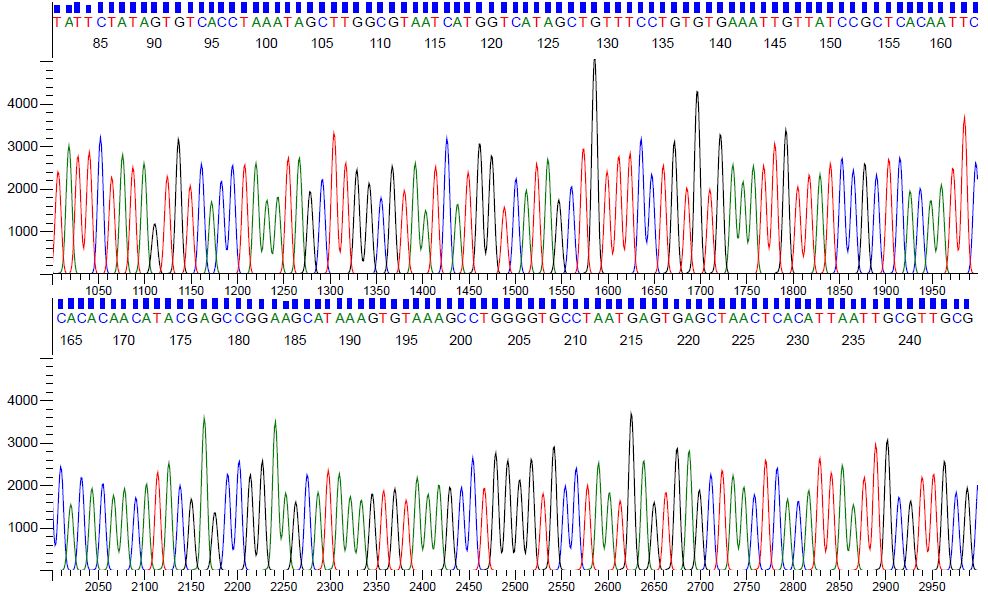
Figure 1. Chromatogram displaying pGEM sequence generated from 80ng of plasmid and 10uM of M13 forward primer.
Poor sequencing reactions that give weak signal strengths can be expected to yield shorter read lengths with ambiguous base calls. Often, smaller peaks beneath larger peaks are due to background noise being amplified by the analysis software. The amplification of background signal occurs when the software detects low signal strength and attempts to normalize sequence signal for the entire read length.
Background noise results in a higher percentage of N's and incorrect base calls. Notice the "noisy" nature of the poor data in Figure 2. The signal strength is weak to the point that the sequence is almost undetectable.
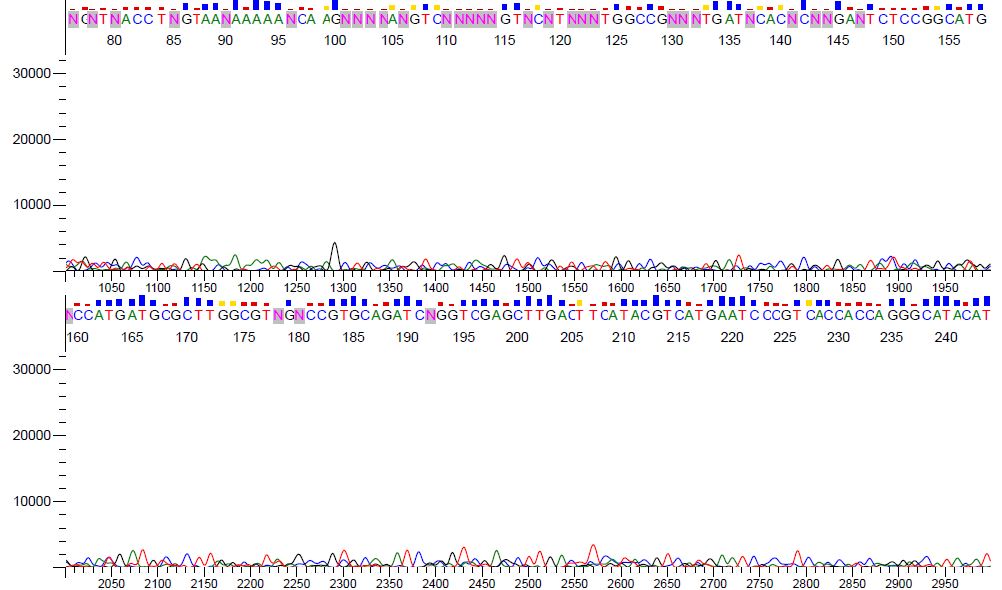
Figure 2. Chromatogram view of poor sequence data.
Signal strength can be used as a general indicator as to how well the sequence reaction performed. These values are found on the chromatogram annotation page (Figure 3). The "Average Raw Signal Intensity" should be >1,000 units. Values <200 units will yield very poor data.
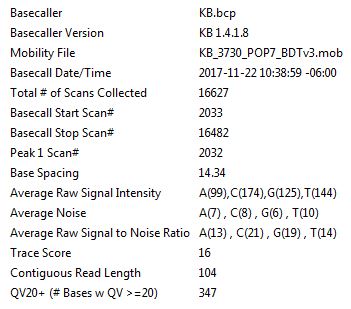
Figure 3. Annotion page view.